Would YOUR house be underwater? Terrifying map reveals the devastation that would be wrought if all the world's ice melted
Ice sheets surrounding the North and South poles make up 10 per cent of our entire planet’s surface, and it’s thought Earth contains five million cubic miles of frozen water - so what would happen if it all melted? National Geographic has created a series of interactive maps demonstrating the catastrophic effect Earth’s ice could cause if it melted and flowed into the oceans and seas. This could cause sea levels to rise by 216 feet, devouring cities and even countries all the while drastically altering how continents and coastlines look, and wiping out entire populations. If these ice sheets melted, the rest of the world would be affected. In Europe, pictured, cities including London and Venice would be lost underwater, as would the whole of the Netherlands and most of Denmark. It would also cause the Mediterranean to expand and swell the Black and Caspian Seas WHAT WAS THE EOCENE EPOCH?The Eocene epoch was a period of increased global temperatures that lasted from 56 to 34 million years ago. During this period of time, little to no ice was found on Earth and there was little difference in temperature at the equator compared to the poles. The planet slowly cooled as carbon dioxide from the air locked inside seafloor sediments. During this decrease ice began to reappear at the poles, and the Antarctic ice sheet began to expand rapidly. Scientists believe it could take around 5,000 years for temperatures to rise significantly enough to melt all the ice on the planet, but claim the planet is already seeing the beginnings of this. Over the past century, reports suggest the Earth's temperature has increased by around half a degree Celsius and, according to the U.S. Environmental Protection Agency (EPA), this has already caused sea levels to rise by around seven inches. The largest concentrations of ice on Earth are found in Greenland and Antarctica but it is also found on exposed areas, on mountain tops and in other regions. The East Antarctica ice sheet, for example, is so large it contains around 80 per cent of all the ice on the planet and its size has protected it previously during warmer periods in Earth’s history. This includes during the Eocene epoch - a period of increased global temperatures that lasted from 56 to 34 million years ago. During this period of time, little to no ice was present on Earth and there was little difference in temperature at the equator compared to the poles. Warming oceans are already melting the floating ice sheet in west Antarctica and since 1992, National Geographic reports the sheet has lost around 65 million metric tonnes of ice each year. The last time the Earth was ice-free was 34 million years ago during the Eocene epoch. If this happened again, the entire Atlantic seaboard in the U.S would vanish, wiping out Florida and the Gulf Coast. While the hills in San Francisco would become islands and San Diego would be lost forever The ice sheets in Greenland and west Antarctica shrank significantly during the epoch and if temperatures were to rise in a similar manner again, the ice sheets across the regions could disappear into the sea completely. If these sheets melted, it would create a knock-on effect for the rest of the world. In Europe, for example, cities including London and Venice would be lost underwater, as would the whole of the Netherlands and most of Denmark. It would also cause the Mediterranean to expand and swell the Black and Caspian Seas. The EPA claims that overall ice reduction depends on several factors, including the rate at which levels of greenhouse gases rise and how global temperatures react to this increase in gas. The largest concentrations of ice on Earth are found in Greenland and Antarctica, pictured. Warming oceans are already melting the floating ice sheet in west Antarctica and since 1992, National Geographic reports the sheet loses around 65 million metric tonnes each year. If they melted it could cause the sea levels to rise globally by 216 feet This rise in greenhouse gases could be caused by humans, as National Geographic explained: ‘If we burn all the Earth’s supply of coal, oil, and gas, adding some five trillion more tonnes of carbon to the atmosphere, we’ll create a very hot planet with an average temperature of perhaps 80 degrees Fahrenheit instead of the current 58. Large swaths of it might become too hot for humans.’ This would make the Earth ice-free for the first time in 34 million years. If this happened, the entire Atlantic seaboard in the U.S would vanish, wiping out Florida and the Gulf Coast. While the hills in San Francisco would become islands and San Diego would be lost forever. In the east, China and Bangladesh would both be completely flooded, wiping out around 760 million people based on current population levels.The coastlines of India would also be reduced. Whereas in South America, the Amazon Basin and the Paraguay River Basin would both become Atlantic inlets and this would wipe out Buenos Aires, coastal Uruguay, and some of Paraguay. In the east, parts of Asia, including China and Bangladesh would be completely flooded, wiping out around 760 million people based on current population levels. Parts of India's coastline would also be lost and eroded inland. National Geographic said: 'If we burn all the Earth's supply of coal, oil, and gas, adding some five trillion more tonnes of carbon to the atmosphere, we'll create a very hot planet with an average temperature of perhaps 80 degrees Fahrenheit instead of the current 58' The only areas that would survive are mountainous stretches along the Caribbean coast and in Central America. The other continents would escape a little more lightly, but would still be affected. In Africa, for example, Egypt, Alexandria and Cairo would be flooded but the continent wouldn’t lose as much of its land to the rising seas. National Geographic claims the Earth’s rising heat ‘might make much of it inhabitable’ though. Australia would gain a new inland sea but it ‘would lose much of the narrow coastal strip where four out of five Australians now live.’
| London could become 'Britain's Atlantis': Map shows how the capital would be lost if the polar ice caps melted
If the worst-case scenario predictions about rising sea levels are accurate, the majority of London could one day be lost underwater. Using estimates from the US Geological Survey, an urban planner has created a series of maps to show what damage could be caused if the ice sheets melt due to climate change. The only areas that would escape the worst of the flooding would be the highest points in the capital including Hampstead Heath, Shooter's Hill and parts of Crystal Palace.
Using estimates from the US Geological Survey, an urban planner has created maps that show what damage could be caused to London if the Antarctic and Greenland ice sheets melted. This GIF shows London following a 131ft (40 metre) rise up to an 262ft (80 metre) rise in global water levels The maps and GIF were designed by visual artist Jeffrey Linn for his Spatialities site. He is currently working on a graphic novel with the University of Leeds to show how parts of the UK would look in 200 years if nothing is done to curb carbon emissions. According to the USGS, Earth’s climate has warmed around 1°C (1.8°F) over the past 100 years. If present trends continue, including an increase in global temperatures caused by increased greenhouse-gas emissions, it predicts many of the world’s mountain glaciers will disappear. For example, at the current rate of melting, most glaciers will vanish from Glacier National Park, Montana, by the middle of the next century. +6 The maps and GIF were designed by visual artist Jeffrey Linn for his Spatialities site. He is currently working on a graphic novel with the University of Leeds to show how parts of the UK would look in 200 years if nothing is done to curb carbon emissions. This map shows London following a 181ft (40-metre) rise +6 Complete melting of ice sheets could lead to a sea-level rise of about 262ft (80 metres), according to the USGS. If this happened, the only areas that would escape the worst of the flooding would be the highest points in the capital including Hampstead Heath, Shooter's Hill and parts of Crystal Palace And in Iceland, glaciers will decrease by 40 per cent by 2100 and virtually disappear by 2200. Most of the current global land ice mass is located in the Antarctic and Greenland ice sheets, and complete melting of these ice sheets could lead to a sea-level rise of about 262ft (80 metres). Mr Linn used this figure to show what London would look like if half of these ice sheets melted, and if they melted completely. He doesn't put a timeframe on when this could potentially occur. The designer has previously made maps showing how Seattle, Portland and San Diego would similarly look underwater. HOW THE THAMES BARRIER PROTECTS LONDONLast year, the Environment Agency created a similar map to Mr Linn's that highlighted what London would look like if sea levels continue to rise and the Thames Barrier wasn’t there to protect it. Parts of Beckton, Whitechapel and Southwark are shown under water (pictured) Last year, the Environment Agency created a similar map to Mr Linn's that highlighted what London would look like if sea levels continue to rise and the Thames Barrier wasn’t there to protect it. In particular, the map highlights what would happen if the capital was hit by 'severe' tidal surges. Parts of Beckton, West Ham, Whitechapel and Southwark are all shown completely submerged with only a handful of spots across the floodplain escaping the flooding. Melting ice from the poles could make sea levels rise by up to three feet by the end of the century, according to academics from the European Ice2sea programme, the British Antarctic Survey and Bristol University. They claim there is a one in 20 chance that ocean levels around the British coast could be around a metre higher by 2100 as a result of climate change. The movable Thames Barrier is made up of 10 gates attached to 128ft (39-metre) tall cofferdam piles, which are buried 79ft (24 metres) into the river bed. Individual gates can be closed in ten minutes but the whole barrier takes an hour and half to close completely. When fully raised, the barrier creates a solid steel wall preventing water flowing upstream towards the capital. The four main gates span 200ft (61 metres) and weigh over 3,300 tonnes each. Each gate is 66ft (20 metres) high and can hold back loads of up to 9,000 tonnes. A separate map released earlier this week revealed how New York could undergo devastating increases in temperature, rainfall and sea level as a result of global warming. A Nasa-backed report predicts annual temperatures will increase 4.1°F to 5.7°F by the 2050s and 5.3°F to 8.8°F by the 2080s. The frequency of heat waves is set rise to two per year in the 1980s to roughly six per year by the 2080s. +6 A separate map has revealed how New York could be devastated by increases in rainfall and sea level. Large areas of Queens (light green) will be hit by floods in the 2020s, while areas of Brooklyn and the Bronx (yellow) will face the same fate in the 2050s. The purple shows the high-risk zones in New York +6 Pictured are observed and projected temperature in New York City. The frequency of heat waves is set rise to two per year in the 1980s to roughly six per year by the 2080s, according to the report The predictions were made by the New York City Panel on Climate Change (NPCC) 2015, which is co-chaired by Nasa researcher, Cynthia Rosenzweig. While New York summers will get even hotter, rainfall will increase four to 11 per cent by the 2050s and five to 13 per cent by the 2080s, the report predicts. Sea levels have already risen in New York City 1.1ft (0.3 metres) since 1900. That is almost twice the observed global rate of 0.5 to 0.7 inches per decade. +6 Map of annual temperature changes in the Northeast in 2050. In New York, Nasa predicts annual temperatures will increase 4.1°F to 5.7°F by the 2050s and 5.3°F to 8.8°F by the 2080s +6 The report also uses Nasa Landsat 7 data to map the surface temperature of mid-town Manhattan and show the cooling effect of Central Park (pictured) The group created the map which reveals how large areas of Queens will be hit by floods in the 2020s, while areas of Brooklyn and the Bronx will face the same fate in the 2050s. Coastal areas of Staten Island and Manhattan will be battling high tides as sea level rises 10 inches in as little as five years, the report claims. THE WESTERN US MEGA-DROUGHTThe NPCC report follows a separate study which found the western US will face increasingly severe mega-droughts later this century. Since the year 2000, seven western states in the US has seen their driest periods in centuries. These states are Arizona, California, Colorado, Nevada, New Mexico, Utah and Wyoming And scientists in California have warned that the region may be experiencing a century-long 'mega-drought'. The warnings came after sediment studies showed California is currently experiencing the driest spell since 1580, and that the regular rainfall seen during the last century is likely to have been a temporary deviation in a cycle of droughts and very occasional rainfall over the last 3,000 years. In 2013, California received less rain than in any year since its formation as a state in 1850. However droughts lasting more than 100 years are far from unheard of in the state. Looking back over several thousand years, droughts have been known to last over a decade, and in some cases they can last a century. And the patterns tend to repeat, meaning another drought of this length will probably happen again in the future. Projections for sea level rise in New York City will increase from 11 inches to 21 inches by the 2050s, 18 inches to 39 inches by the 2080s, and, 22 inches to 50 inches. In the worst case, sea levels will rise by up to six feet (1.8 metres), by 2100. Last year, the Environment Agency created a similar map to Mr Linn's that highlighted what London would look like if sea levels continue to rise and the Thames Barrier wasn’t there to protect it. In particular, the map highlights what would happen if the capital was hit by 'severe' tidal surges. Parts of Beckton, West Ham, Whitechapel and Southwark are all shown completely submerged with only a handful of spots across the floodplain escaping the flooding. Melting ice from the poles could make sea levels rise by up to three feet by the end of the century, according to academics from the European Ice2sea programme, the British Antarctic Survey and Bristol University. They claim there is a one in 20 chance that ocean levels around the British coast could be around a metre higher by 2100 as a result of climate change. If such rises were to take place, London’s current sea defences would struggle to cope, with the capital at risk of flooding once a decade. The movable barrier is made up of 10 gates attached to 39-metre tall cofferdam piles, which are buried 24 metres into the river bed. Individual gates can be closed in ten minutes but the whole barrier takes an hour and half to close completely. When fully raised, the barrier creates a solid steel wall preventing water flowing upstream towards the capital. The four main gates span 200ft (61 metres) and weigh over 3,300 tonnes each. Each gate is 66ft (20 metres) high and can hold back loads of up to 9,000 tonnes. Effect of flooding in London without the Thames Barrier The Thames Barrier (pictured) was opened in 1982 and is a 520m-long flood defence system near Woolwich in east London. Individual gates can be closed in ten minutes but the whole barrier takes an hour and half to close completely. The barrier can hold back up to 9,000 tonnes of water to protect London from flooding |


|
| It is a small Alaskan village whose inhabitants have relied on the sea for countless generations. But within a decade, it is expected that the ocean which the village of Kivalina has so relied on will completely destroy it - creating America's first climate change refugees. Temperatures in the Arctic region of Alaska are warming twice as fast as the rest of the U.S, causing ice to retreat, sea levels to rise and coastal erosion to increase.
Worrying: It is predicted that within a decade the Alaskan village of Kivalina will be completely underwater - creating America's first climate change refugees Extreme: Kivalina is located on a barrier island off the coast of northwest Alaska. Many of the Inupiat Eskimo villagers rely on wild animals to survive At risk: A dramatic retreat of Arctic ice has left the village vulnerable to coastal erosion Protection: The inhabitants of the village have always been protected from ferocious storms by a think layer of ice. Instead, they now rely on these sandbags The 400 indigenous Inuit inhabitants of Kivalina, who live in single-storey cabins, have always been protected from the ferocious autumn and winter storms by a think layer of ice. But, as reported by the BBC, during the last two decades there has been a huge retreat of Arctic ice, leaving the village vulnerable to coastal erosion. The U.S government has attempted to help, but its solutions have never been long-term. A defensive wall was built along the beach in 2008. However, it could not prevent an emergency evacuation two years ago following an enormous storm. Climate change refugees: Kivalina residents forced to flee Angry: The inhabitants of Kivalina are furious, saying they are having to pick up a mess which was not created by them Tough: Many of the 400 indigenous Inuit inhabitants of Kivalina live in single-storey cabins Icy: This aerial image of Kivalina taken in 2008 shows the partly ice covered sea to the left Reduction: However, this image taken this year shows how much the ice surrounding Kivalina has melted Remote: This map shows the isolated location of Kivalina within the Alaskan wilderness Now, engineers predict the 7.5 mile-long barrier island will be uninhabitable by 2025, completely submerged by the surrounding Chukchi Sea. The U.S government estimates that it would cost up to $400, (£265m) to relocate the residents to higher ground. But, with there being no sign that the money will come from public funds, the indigenous residents of the village are furious. Speaking to the BBC, Kivalina council leader, Colleen Swanm, said: 'If we're still here in 10 years time we either wait for the flood and die, or just walk away and go someplace else. 'The US government imposed this Western lifestyle on us, gave us their burdens and now they expect us to pick everything up and move it ourselves. What kind of government does that?' A census taken in 2000 shows there were 377 people on Kivalina in 78 households with a total of 64 families residing in the village. It revealed the racial makeup of the village was 3.45 per cent white with 96.55 per cent Native American. Perhaps most worryingly for its future, of the 78 households, 61.5% had children under the age of 18 living with them. When President Obama promised to take measures to combat climate change it provoked strong opposition. But those campaigning to highlight the issues of global warming will show the cynics how, through Kivalina, it is happening in their own country. Concerns: Built on this long, narrow stretch of land, Kivalina is now extremely vulnerable to the sea Desperate: Residents are now using every means possible to save their homes Traditional: This image from Kivalina, taken around 1900, shows members of the Eskimo town council Wrapped up: Pupils from the village's school are pictured around 1900 DOOMED VILLAGE HOME TO DOZENS OF FAMILIES WITH CHILDRENKivalina was first known as Kivualinagmut after its discovery in 1847 by the Russian Navy. Since then, it has long been a stopping place for travelers heading to Arctic coastal areas. The most recent census shows there were 377 people on Kivalina living in 78 households. Perhaps most worryingly for its future, of the 78 households, 61.5 per cent had children under the age of 18 living with them. It is the only village in the region where people hunt the bowhead whale. Originally, it was located at the north end of the Kivalina Lagoon but later relocated. In 1960, an airstrip was built on the island. A new school and an electric system were constructed during the 1970s. The problems in Kivalina are also experienced in the most northerly tip of US territory in the town of Barrow. The residents of the town have been fraught with problems this year thanks to climate change. In March, the sea ice began to melt and break up. After eventually refreezing, it was so unstable that the townsfolk were unable to hunt for whales and seals, completely wrecking their hunting season. Experienced whale hunters say for the first time in decades, they caught not a single bowhead whale. Residents now face a long, bleak winter. Climate change is a divisive issue in the U.S among politicians. New Jersey Democratic Rush Holt released a 90-second YouTube campaign ad last Monday in which he calls for a carbon tax. Without it, he warns, 'millions will die.'On his campaign website the eight-term congressman, one of two physicists in the House of Representatives, blames global warming on 'the assault that corporate interests are waging on our planet.''We can no longer allow Republicans to deny obvious truths,' Holt says in the longer version of his campaign video. 'Our climate is changing, the consequences are lethal, humans are responsible, and America must act.'
This chilling series of images give an alarming projection of how some of America’s most famous tourism destinations could look in the future if global warming continues unabated.A new series of images provide food-for-thought when it comes to the future of some of America's most populated coastal towns. Nickolay Lamm, 24, has produced some worrying illustrations of how California's biggest cities will become lost to the ocean if scientists' predictions of the effects of global warming prove correct. San Francisco, becomes consumed by the very bay it is constructed next to. Venice Beach resembles scenes from Venice, Italy as the Pacific Ocean slowly deluges the trendy Los Angeles neighborhood. And San Diego's position as a naval town is virtually washed away as the unforgiving sea water floods the towns docks and promenades. Venice, California: Today, Venice is known for its canals, beaches and circus-like Ocean Front Walk, a two-and-a-half-mile pedestrian-only promenade Venice of America: Venice Beach would have more in common with its Italian namesake if the sea levels rise 12 feet as shown here Submarine required: Venice Beach has long since disappeared in this shocking vision of the future after sea levels rise by 25 feet Drowning slowly: Even at a 5-foot rise in sear level, the beach is able to keep the rising Pacific at bay and life continues as normal With a rise in sea levels of 12-feet, the famous beach and its promenade is all but washed away Sufin' USA: You might need a surfboard more than a skateboard to get around parts of Venice in the year 2500! It could take several centuries for sea levels to rise to that level but artist and researcher Nickolay Lamm hopes his work will raise public awareness about the very real threat of global warming today. Mr Lamm used data and methods from Climate Central, an independent organization of leading scientists and journalists researching and reporting the facts about the changing climate and its impact on the American public. Nickolay interpreted Climate Central's sea level rise maps and flood elevation formula to arrive at these images 'Sea level rise that makes cities uninhabitable is not going to happen in our lifetime, but, it is going to happen sooner or later unless we cut carbon emissions. Our first sea level rise project covered only East Coast cities. I felt it would be fitting to bring attention to sea level rise on the West Coast as well,' he says. Sabrina Warner keeps having the same nightmare: a huge wave rearing up out of the water and crashing over her home, forcing her to swim for her life with her toddler son. "I dream about the water coming in," she said. The landscape in winter on the Bering Sea coast seems peaceful, the tidal wave of Warner's nightmare trapped by snow and several feet of ice. But the calm is deceptive. Spring break-up will soon restore the Ninglick River to its full violent force. In the dream, Warner climbs on to the roof of her small house. As the waters rise, she swims for higher ground: the village school which sits on 20-foot pilings. Even that isn't high enough. By the time Warner wakes, she is clinging to the roof of the school, desperate to be saved. Warner's vision is not far removed from a reality written by climate change. The people of Newtok, on the west coast of Alaska and about 400 miles south of the Bering Strait that separates the state from Russia, are living a slow-motion disaster that will end, very possibly within the next five years, with the entire village being washed away. The Ninglick River coils around Newtok on three sides before emptying into the Bering Sea. It has steadily been eating away at the land, carrying off 100ft or more some years, in a process moving at unusual speed because of climate change. Eventually all of the villagers will have to leave, becoming America's first climate change refugees. It is not a label or a future embraced by people living in Newtok. Yup'ik Eskimo have been fishing and hunting by the shores of the Bering Sea for centuries and the villagers reject the notion they will now be forced to run in chaos from ancestral lands. But exile is undeniable. A report by the US Army Corps of Engineers predicted that the highest point in the village – the school of Warner's nightmare – could be underwater by 2017. There was no possible way to protect the village in place, the report concluded. If Newtok can not move its people to the new site in time, the village will disappear. A community of 350 people, nearly all related to some degree and all intimately connected to the land, will cease to exist, its inhabitants scattered to the villages and towns of western Alaska, Anchorage and beyond. It's a choice confronting more than 180 native communities in Alaska, which are flooding and losing land because of the ice melt that is part of the changing climate. The Arctic Council, the group of countries that governs the polar regions, are gathering in Sweden today. But climate change refugees are not high on their agenda, and Obama administration officials told reporters on Friday there would be no additional money to help communities in the firing line. On the other side of the continent, the cities and towns of the east coast are waking up to their own version of Warner's nightmare: the storm surges demonstrated by hurricane Sandy. About half of America's population lives within 50 miles of a coastline. Those numbers are projected to grow even more in the coming decades. What chance do any of those communities, in Alaska or on the Atlantic coast, have of a fair and secure future under climate change, if a tiny community like Newtok – just 63 houses in all – cannot be assured of survival? But as the villagers of Newtok are discovering, recognising the gravity of the threat posed by climate change and responding in time are two very different matters. Remote location Newtok lies 480 miles due west of Anchorage. The closest town of any size, the closest doctor, gas station, or paved road, is almost 100 miles away. The only year-round link to the outside world is via a small propeller plane from the regional hub of Bethel. The seven-seater plane flies over a landscape that seems pancake flat under the snow: bright white for land, slightly translucent swirls for frozen rivers. There are no trees. The village as seen from the air is a cluster of almost identical small houses, plopped down at random on the snow. The airport is a patch of ground newly swept of snow, marked off for the pilot by a circle of orange traffic cones. The airport manager runs the luggage into the centre of the village on a yellow sledge attached to his snowmobile. Like many if not most native Alaskan villages, Newtok owes its location to a distant bureaucrat. The Yup'iks, who had lived in these parts of Alaska for hundreds of years, had traditionally used the area around present-day Newtok as a seasonal stopping-off place, convenient for late summer berry picking. Even then, their preferred encampment, when they passed through the area, was a cluster of sod houses called Kayalavik, some miles further up river. But over the years, the authorities began pushing native Alaskans to settle in fixed locations and to send their children to school. It was difficult for supply barges to manoeuvre as far up river as Kayalavik. After 1959, when Alaska became a state, the new authorities ordered villagers to move to a more convenient docking point. 1 of 20 It takes two hours from Anchorage to fly to Bethel and another 90 minutes in a smaller plane that stops in villages on the way, to reach Newtok.Photograph: That became Newtok. Current state officials admit the location – on low-lying mud flats between the river and the Bering Sea – was far from perfect. It certainly wasn't chosen with a view to future threats such as climate change. "The places are often where they are because it was easy to unload the building materials and build the school and the post office there," said Larry Hartig, who heads the state's Commission on Environmental Conservation. "But they weren't the ideal place to be in terms of long-term stability and it's now creating a lot of problems that are exacerbated by melting permafrost and less of the seasonal sea ice that would form barriers between the winter storms and uplands." It became clear by the 1990s that Newtok – like dozens of other remote communities in Alaska – was losing land at a dangerous rate. Almost all native Alaskan villages are located along rivers and sea coasts, and almost all are facing similar peril. 186 Alaskan villages are at risk because of climate change $130 million could be the full cost of moving just the one village, Newtok Source: US GAO A federal government report found more than 180 other native Alaskan villages – or 86% of all native communities – were at risk because of climate change. In the case of Newtok, those effects were potentially life threatening. A study by the US Army Corps of Engineers on the effects of climate change on native Alaskan villages, the one that predicted the school would be underwater by 2017, found no remedies for the loss of land in Newtok. The land was too fragile and low-lying to support sea walls or other structures that could keep the water out, the report said, adding that if the village did not move, the land would eventually be overrun with water. People could die. It was a staggering verdict for Newtok. Some of the village elders remember the upheaval of that earlier move. The villagers were adamant that they take charge of the move this time and remain an intact community – not scatter to other towns. And so after years of poring over reports, the entire community voted to relocate to higher ground across the river. The decision was endorsed by the state authorities. In December 2007, the village held the first public meeting to plan the move. The proposed new site for Newtok, voted on by the villagers and approved by government planners, lies only nine miles away, atop a high ridge of dark volcanic rock across the river on Nelson Island. On a good day in winter, it's a half-hour bone-shaking journey across the frozen Ninglick river by snowmobile. But the cost of the move could run as high as $130m, according to government estimates. For the villagers of Newtok, finding the cash, and finding their way through the government bureaucracy, is proving the challenge of their lives. Five years on from that first public meeting, Newtok remains stuck where it was, the peeling tiles and the broken-down office furniture in the council office grown even shabbier, the dilapidated water treatment plant now shut down as a health hazard, an entire village tethered to a dangerous location by bureaucratic obstacles and lack of funds. Village leaders hope that this coming summer, when conditions become warm enough for construction crews to get to work, could provide the big push Newtok needs by completing the first phase of basic infrastructure. And the effort needs a push. When the autumn storms blow in, the water rises fast. The City by the Bay: AT&T Park, home of the San Francisco Giants baseball team is already perched perilously close to the bay from which the city earns its nickname. Changing climate Climate change remains a politically touchy subject in Alaska. The state owes its prosperity to the development of the vast Prudhoe Bay oil fields on the Arctic Coast. Even in Newtok, there are some who believe climate change is caused by negative emotions, such as anger, hate and envy. But while some dispute the overwhelming scientific view that climate change is caused primarily by human activities, there is little argument in Alaska about its effects. Life in the arctic climateIn Newtok, Alaska, almost half of the year the temperature is below freezing. Today's forecast - live JanFebMarAprMayJunJulAugSepOctNovDec-40°F-20°F0°F20°F40°F60°F80°F100°FFreezingRecord rangeAverageLast yearToday's avg.Newtok51°F51°F34°FNY66°F66°F55°FLA79°F79°F60°FDC85°F85°F62°FLondon67°F67°F49°F Source: Forecast.io, Weather.com The state has warmed twice as fast as the rest of the country over the past 60 years. Freeze-up occurs later, snow is wetter and heavier. Wildfires erupt on the tundra in the summer. Rivers rush out to the sea. Moose migrate north into caribou country. Grizzlies mate with polar bear as their ranges overlap. Even people in their 20s, like Warner and her partner Nathan Tom, can track the changes in their own lifetimes. Tom said the seasons have changed. "The snow comes in a different timing now. The snow disappears way late. That is making the geese come at the wrong time. Now they are starting to lay their eggs when there is still snow and ice and we can't go and pick them," Tom said. "It's changing a lot. It's real, global warming, it's real." It's real, global warming, it's real. Nathan Tom, a Newtok resident On days when the clouds move in, and the only sound is the crunch of boots on snow and the distant buzzing of snowmobiles, it's difficult to imagine a world beyond the village, let alone a threat. But Warner has seen the river rip into land and carry off clumps of earth. "It's scary thinking about summer coming," she said. "I don't know how much more is going to erode – hopefully not as much as last year." Warner was raised in Anchorage and Wasilla, mainly by her non-Yup'ik father. But she was introduced to Yup'ik food and Yupi'ik ways by her mother, and she has taken to village life since moving to Newtok in December 2011 to be with Tom. Even in those short months, she said she can see the changes carved out on the land behind the family home. "When I first got here the land used to be way out there," she said, pointing towards the west. "Now that doesn't exist any more. There is no land there any more." The river claims more of the village every year. Warmer temperatures are thawing the permafrost on which Newtok is built, and the land surface is no longer stable. The sea ice that protected the village from winter storms is thinning and receding, exposing Newtok to winter storms with 100mph winds and the waves of Warner's nightmare. When the wind blows from the east or south, the land falls away even faster. The patch of land where Warner picked last summer to practice shooting was gone, on the other side of a sharp drop-off to the river. "The summer came, 15 or 20ft of land went just from melting, and then after we had those storms in September another 20ft went," she said. In an average year the river swallows 83ft of land a year, according to a report by the Government Accountability Office. Some years of course it's more. Living on the edgeBy Richard Sprenger and Suzanne Goldenberg Erosion is bringing the Ninglick River to Sabrina Warner and Nathan Tom's doorstep The reddish-brown house where Tom and Warner live with their son Tyson and elderly relatives is the closest in the village to the Ninglick. Warner fears her house will soon be swallowed up by that hungry river. "Two more years, that's what I'm guessing. About two more years until it's right up to our house," she said. The house is now barely 200 paces away from the drop-off point. It's become a sort of tourist stop for visitors to the village, and an educational aid for teachers at the local school. Last year, one of the teachers set out stakes to mark how fast the river was rising. At least one has already been washed away. But it won't be long before nobody in the village is safe. Other homes, once considered well back from the river, now regularly flood. Over the years the river, in its attack on the land, engulfed a few small ponds – some fresh water, some used as raw sewage dumps – spewing human waste across the village. Last summer it almost carried off a few dumpsters filled with old fridges and computers. It swept away the barge landing, and infested the landfill. Sometimes, though, the river gives up treasure: villagers walking newly exposed banks have discovered mammoth tusks and fossil remains. During one storm last autumn, Warner stayed up until 4am, waiting to see if the waves would engulf the house. "I was scared because it looked so close because our window is right there. I was just looking out, and you can see these huge waves come at you," she said. It's not easy living with that fear every day, she concedes. Anxious residents want to know that their future will be safe. They are exhausted by the years of uncertainty and fed up with a village left to decay, with leaders' energy and every scrap of funding focussed on the relocation. "Considering that our house is the closest, I would like it if they would at least let us know if we are going to have a house over there [at the new site]", said Warner. Tom's grandmother, who needs oxygen, lives with the couple. It would be tough to move her in the event of a disaster, although she claims she is not at all afraid. The young couple go through times when they can't deal with the talk of relocation. Tom bought a big tent some time ago and the couple have talked about camping out at the site chosen for the new village, just to get away – from the stress, from the drama of village politics – until things are settled. But the relocation keeps being put off. "A few years ago, they said next year. And then last year they said next year. And next year, they are probably going to say next year again," said Tom. But he soon perks up. The village has sent local men, including Tom, for training as construction workers. "It's picking up," he said. "I'm not afraid any more. The erosion is really fast. I know the state is going to deal with it pretty fast. They are not going to leave us hanging there." Fancy a swim? Just 12 feet of water turns the baseball stadium into an open-air swimming pool as the bay begins to consume the city According to the Intergovernmental Panel of Climate Change, the seas will rise by an average of 6.6 feet by 2100. Then over the coming centuries, as temperatures rise and ice sheets melt, the oceans could rise as much as 20 or 30 feet. Lamm has created images which show famous cities will look like under 5 feet (projected increase over the next 100 to 300 years), 12 feet (potential level in 2300), and 25 feet (the potential level in coming centuries) of water. The U.S. National Climate Assessment report notes that of an increase in average U.S. temperatures of about 1.5 degrees F since 1895, when reliable national record-keeping began, more than 80 percent had occurred in the past three decades. With heat-trapping gases already in the atmosphere, temperatures could rise by a further 2 to 4 degrees F in most parts of the country over the next few decades, the report said. Sand bags required: Waterfront views are all around as the San Diego water level rises 5 feet higher than present-day levels Lost City: San Diego appears to have more in common with Atlantis in this picture of how things might look in 500 years time San Diego, 25-feet down: This once pretty park is now more suited to divers than dog-walkers! Golden Gate Rust: Beautiful Crissy Field Center, part of the Golden Gate National Park, as it looks today Waterfront views: The resulting illustrations give us a sobering glimpse into our potential future Darling it's better, down where it's wetter... or maybe not as this picture shows San Franciso 12-feet under Beautiful: Crissy Field and the San Francisco skyline. The remaining structures of the former Coast Guard Station are in the foreground Crissy, 5-feet below: As global sea level rises, coastal cities and islands face a growing risk of being washed away A vision of the future: Under 25 feet of water, there's not much left of the old Crissy Field Clean and dry: With a 5-foot change in sea level, very little has altered and life continues as normal San Diego, 25-feet-under: Lamm used sea level rise maps from Climate Central to create a formula to calculate how much water there would be on the ground in a specific location
It could take several centuries for sea levels to rise to that level but Lamm hopes his work will raise public awareness about the very real threat of global warming today, reports StorageFront.
Popular tourist destination: The art deco district of Ocean Drive in Florida as it looks today 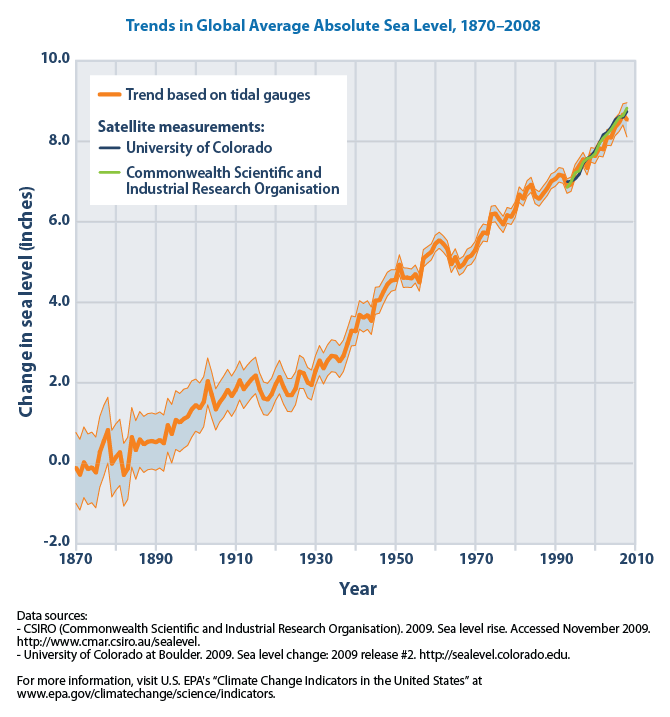 Trends in global average absolute sea level, 1870-2008. Changes in sea level since the end of the last glacial episode. Sea levels around the world are rising. Current sea-level rise potentially affects human populations (e.g., those living in coastal regions and on islands)[2] and the natural environment (e.g., marine ecosystems).[3] Between 1870 and 2004, global average sea levels rose 195 mm (7.7 in).[4] From 1950 to 2009, measurements show an average annual rise in sea level of 1.7 ± 0.3 mm per year, with satellite data showing a rise of 3.3 ± 0.4 mm per year from 1993 to 2009,[5] a faster rate of increase than previously estimated.[6] It is unclear whether the increased rate reflects an increase in the underlying long-term trend. Two main factors contributed to observed sea level rise.[8] The first is thermal expansion: as ocean water warms, it expands.[9] The second is from the contribution of land-based ice due to increased melting. The major store of water on land is found in glaciers and ice sheets. Sea level rise is one of several lines of evidence that support the view that the climate has recently warmed.[10] It is very likely that human-induced (anthropogenic) warming contributed to the sea level rise observed in the latter half of the 20th century.[11] Sea level rise is expected to continue for centuries.[12] In 2007, the Intergovernmental Panel on Climate Change (IPCC) projected that during the 21st century, sea level will rise another 18 to 59 cm (7.1 to 23 in), but these numbers do not include "uncertainties in climate-carbon cycle feedbacks nor do they include the full effects of changes in ice sheet flow".[13] More recent projections assessed by the US National Research Council (2010)[14] suggest possible sea level rise over the 21st century of between 56 and 200 cm (22 and 79 in). On the timescale of centuries to millennia, the melting of ice sheets could result in even higher sea level rise. Partial deglaciation of the Greenland ice sheet, and possibly the West Antarctic ice sheet, could contribute 4 to 6 m (13 to 20 ft) or more to sea level rise.[15] Work by a team led by Veerabhadran Ramanathan of the Scripps Institution of Oceanography suggests quick way to stave off impending sea level rise is to cut emissions of short-lived climate warmers such as methane and sootOverview of sea-level change [edit] Local and eustatic sea level [edit]Water cycles between ocean, atmosphere, and glaciers. Local mean sea level (LMSL) is defined as the height of the sea with respect to a land benchmark, averaged over a period of time (such as a month or a year) long enough that fluctuations caused by waves and tides are smoothed out. One must adjust perceived changes in LMSL to account for vertical movements of the land, which can be of the same order (mm/yr) as sea level changes. Some land movements occur because of isostatic adjustment of the mantle to the melting of ice sheets at the end of the last ice age. The weight of the ice sheet depresses the underlying land, and when the ice melts away the land slowly rebounds. Atmospheric pressure, ocean currents and local ocean temperature changes also can affect LMSL. “Eustatic” change (as opposed to local change) results in an alteration to the global sea levels, such as changes in the volume of water in the world oceans or changes in the volume of an ocean basin.[18] Various factors affect the volume or mass of the ocean, leading to long-term changes in eustatic sea level. The two primary influences are temperature (because the density of water depends on temperature), and the mass of water locked up on land and sea as fresh water in rivers, lakes, glaciers, polar ice caps, and sea ice. Over much longer geological timescales, changes in the shape of oceanic basins and in land–sea distribution affect sea level. Observational and modelling studies of mass loss from glaciers and ice caps indicate a contribution to sea-level rise of 0.2–0.4 mm/yr, averaged over the 20th century. Glaciers and ice capsEach year about 8 mm of ocean water falls on the Antarctica and Greenland ice sheets as snowfall. If no ice returned to the oceans, sea level would drop 8 mm every year. To a first approximation, the same amount of water appeared to return to the ocean in icebergs and from ice melting at the edges. Scientists previously had estimated which is greater, ice going in or coming out, called the mass balance, important because a non-zero balance causes changes in global sea level. High-precision gravimetry from satellites in low-noise flight determined that Greenland was losing more than 200 billion tons of ice per year, in accord with loss estimates from ground measurement.[19] The rate of ice loss was accelerating,[20] having grown from 137 gigatons in 2002–2003.[21] The total global ice mass lost from Greenland, Antarctica and Earth's glaciers and ice caps during 2003-2010 was about 4.3 trillion tons (1,000 cubic miles), adding about 12mm (0.5 inches) to global sea level, enough ice to cover the United States 50cm (1.5 feet) deep.[22] Ice shelves float on the surface of the sea and, if they melt, to a first order they do not change sea level. Likewise, shrinkage/expansion of the northern polar ice cap which is composed of floating pack ice do not significantly affect sea level. Because ice shelf water is fresh, however, melting would cause a very small increase in sea levels, so small that it is generally neglected.
The current rise in sea level observed from tide gauges, of about 1.8 mm/yr, is within the estimate range from the combination of factors above[25] but active research continues in this field. In 1992, satellites began recording the change in sea level;[26][27] they display an acceleration in the rate of sea level change, but they have not been operating for long enough to work out whether this signals a permanent rate change, or an artifact of short-term variation.[citation needed] Short-term variability and long-term trends [edit]On the timescale of years and decades, sea level records contain a considerable amount of variability.[28] For example, approximately a 10 mm rise and fall of global mean sea level accompanied the 1997–1998 El Niño-Southern Oscillation (ENSO) event, and a temporary 5 mm fall accompanied the 2010–2011 event.[29] Interannual or longer variability is a major reason why no long-term acceleration of sea level has been identified using 20th century data alone. However, a range of evidence clearly shows that the rate of sea level rise increased between the mid-19th and mid-20th centuries.[30] Sea level acceleration up to the present has been about 0.01 mm/yr² and appears to have started at the end of the 18th century. Sea level rose by 6 cm during the 19th century and 19 cm in the 20th century.[31] Evidence for this includes geological observations, the longest instrumental records and the observed rate of 20th century sea level rise. For example, geological observations indicate that during the last 2,000 years, sea level change was small, with an average rate of only 0.0–0.2 mm per year. This compares to an average rate of 1.7 ± 0.5 mm per year for the 20th century.[32] Past changes in sea level [edit]Changes in sea level during the last 9,000 years The sedimentary record [edit]Sedimentary deposits follow cyclic patterns. Prevailing theories hold that this cyclicity primarily represents the response of depositional processes to the rise and fall of sea level. The rock record indicates that in earlier eras, sea level was both much lower than today and much higher than today. Such anomalies often appear worldwide. For instance, during the depths of the last ice age 18,000 years ago when hundreds of thousands of cubic miles of ice were stacked up on the continents as glaciers, sea level was 120 metres (390 ft) lower, locations that today support coral reefs were left high and dry, and coastlines were miles farther outward. During this time of very low sea level there was a dry land connection between Asia and Alaska over which humans are believed to have migrated to North America (see Bering Land Bridge).[citation needed] For the past 6,000 years, the world's sea level gradually approached the current level. During the previous interglacial about 120,000 years ago, sea level was for a short time about 6 metres (20 ft) higher than today, as evidenced by wave-cut notches along cliffs in the Bahamas. There are also Pleistocenecoral reefs left stranded about 3 metres above today's sea level along the southwestern coastline of West Caicos Island in the West Indies. These once-submerged reefs and nearby paleo-beach deposits indicate that sea level spent enough time at that higher level to allow reefs to grow (exactly where this extra sea water came from—Antarctica or Greenland—has not yet been determined). Similar evidence of geologically recent sea level positions is abundant around the world.
The Washington Monument on the National Mall in Washington, D.C., built to commemorate George Washington, is one of the U.S.'s most popular tourist destinations Estimates of past changesBased on tide gauge data, the rate of global average sea level rise during the 20th century lies in the range 0.8 to 3.3 mm/yr, with an average rate of 1.8 mm/yr.[39]
US tide gauge measurementsUS sea-level trends 1900–2003 Tide gauges in the United States reveal considerable variation because some land areas are rising and some are sinking. For example, over the past 100 years, the rate of sea level rise varied from about an increase of 0.36 inches (9.1 mm) per year along the Louisiana Coast (due to land sinking), to a drop of a few inches per decade in parts of Alaska (due to post-glacial rebound). The rate of sea level rise increased during the 1993–2003 period compared with the longer-term average (1961–2003), although it is unclear whether the faster rate reflected a short-term variation or an increase in the long-term trend.[40] One study showed no acceleration in sea level rise in US tide gauge records during the 20th century.[41] However, another study found that the rate of rise for the US Atlantic coast during the 20th century was far higher than during the previous two thousand years.[42] Amsterdam Sea Level Measurements [edit]The longest running sea-level measurements are recorded at Amsterdam, in the Netherlands—part of which (about 25%) lies beneath sea level, beginning in 1700.[43]Since 1850, the rise averaged 1.5 mm/year. Australian sea-level change [edit]Records dating from 1837 taken by an amateur meteorologist and a sea level benchmark that was struck on 1 July 1841 on a small cliff on the Isle of the Dead[44] near the Port Arthur convict settlement, when merged with data recorded by modern tide gauges, indicated sea level rise of about 1mm a year.[45] As of 2003 the National Tidal Centre of the Bureau of Meteorology managed 32 tide gauges, some with records since 1880, for the entire coastline.[46] Commonwealth Scientific and Industrial Research Organisation (CSIRO) data shows the current global mean sea level trend to be 3.2 mm/yr[47] and the historical total increase from 1880 to 2009 is about 210mm with an average of 1.6 mm/year[48] Future sea-level rise [edit]Main article: Future sea level Projections [edit]21st century [edit]The 2007 Fourth Assessment Report (IPCC 4) projected century-end sea levels using the Special Report on Emissions Scenarios (SRES). SRES developed emissions scenarios to project climate-change impacts.[49] The projections based on these scenarios are not predictions,[50] but reflect plausible estimates of future social and economic development (e.g., economic growth, population level).[51] The six SRES "marker" scenarios projected sea level to rise by 18 to 59 centimetres (7.1 to 23 in).[13] Their projections were for the time period 2090–99, with the increase in level relative to average sea level over the 1980–99 period. This estimate did not include all of the possible contributions of ice sheets. More recent research from 2008 observed rapid declines in ice-mass balance from both Greenland and Antarctica, and concluded that sea-level rise by 2100 is likely to be at least twice as large as that presented by IPCC AR4, with an upper limit of about two meters.[52] A literature assessment published in 2010 by the US National Research Council described the above IPCC projections as "conservative," and summarized the results of more recent studies.[14] These projections ranged from 56–200 centimetres (22–79 in), based on the same period as IPCC 4. In 2011, Rignot and others projected a rise of 32 centimetres (13 in) by 2050. Their projection included increased contributions from the Antarctic and Greenland ice sheets. Use of two completely different approaches reinforced the Rignot projection.[53][54] After 2100 [edit]See also: Global climate model#Projections of future climate change This graph shows the projected change in global if atmospheric carbon dioxide (CO2) concentrations were to either quadruple or double. [55] The projection is based on several multi-century integrations of a GFDL global coupled ocean-atmosphere model. These projections are the expected changes due to thermal expansion of sea water alone, and do not include the effect of melted continental ice sheets. With the effect of ice sheets included, the total rise could be larger by a substantial factor.[55]Image credit: NOAA GFDL. There is a widespread consensus that substantial long-term sea-level rise will continue for centuries to come.[12] IPCC 4 estimated that at least a partial deglaciation of the Greenland ice sheet, and possibly the West Antarctic ice sheet, would occur given a global average temperature increase of 1–4 °C (relative to temperatures over the years 1990–2000).[56] This estimate was given about a 50% chance of being correct.[57] The estimated timescale was centuries to millennia, and would contribute 4 to 6 metres (13 to 20 ft) or more to sea levels over this period. There is the possibility of a rapid change in glaciers, ice sheets, and hence sea level.[58] Predictions of such a change are highly uncertain due to a lack of scientific understanding. Modeling of the processes associated with a rapid ice-sheet and glacier change could potentially increase future projections of sea-level rise. Projected impacts [edit]Future sea level rise could lead to potentially catastrophic difficulties for shore-based communities in the next centuries: for example, many major cities such as London, New Orleans, and New York [59] already need storm-surge defenses, and would need more if the sea level rose, though they also face issues such as subsidence.[60] Sea level rise could also displace many shore-based populations: for example it is estimated that a sea level rise of just 200 mm could create 740,000 homeless people in Nigeria.[61] Maldives, Tuvalu, and other low-lying countries are among the areas that are at the highest level of risk. The UN's environmental panel has warned that, at current rates, sea level would be high enough to make the Maldives uninhabitable by 2100.[62][63] Future sea-level rise, like the recent rise, is not expected to be globally uniform (details below). Some regions show a sea-level rise substantially more than the global average (in many cases of more than twice the average), and others a sea level fall.[64] However, models disagree as to the likely pattern of sea level change.[65] In September 2008, the Delta Commission (Deltacommissie (2007)) presided by Dutch politician Cees Veerman advised in a report that the Netherlands would need a massive new building program to strengthen the country's water defenses against the anticipated effects of global warming for the next 190 years. This commission was created in September 2007, after the damage caused by Hurricane Katrina prompted reflection and preparations. Those included drawing up worst-case plans for evacuations. The plan included more than €100 billion (US$144 bn), in new spending through the year 2100 to take measures, such as broadening coastal dunes and strengthening sea and river dikes. The commission said the country must plan for a rise in the North Sea up to 4.25 feet (51 inches, 1.3 m) by 2100, rather than the previously projected 2.5 feet (30 inches, 0.80 m), and plan for a 6.5 – 13 feet (80 - 160 inches, 2 – 4 m) rise by 2200.[66] Main article: Delta Works IPCC Third Assessment [edit]The results from the IPCC Third Assessment Report (TAR) sea level chapter are given below. IPCC change factors 1990–2100 Thermal expansion Glaciers Greenland ice Antarctic ice Terrestrial storage Ongoing contributions from ice sheets in response to past climate change Thawing of permafrost Deposition of sediment Total global-average sea level rise The sum of these components indicates a rate of eustatic sea level rise (corresponding to a change in ocean volume) from 1910 to 1990 ranging from −0.8 to 2.2 mm/yr, with a central value of 0.7 mm/yr. The upper bound is close to the observational upper bound (2.0 mm/yr), but the central value is less than the observational lower bound (1.0 mm/yr), i.e., the sum of components is biased low compared to the observational estimates. The sum of components indicates an acceleration of only 0.2 (mm/yr)/century, with a range from −1.1 to +0.7 (mm/yr)/century, consistent with observational finding of no acceleration in sea-level rise during the 20th century. The estimated rate of sea-level rise from anthropogenic climate change from 1910 to 1990 (from modeling studies of thermal expansion, glaciers and ice sheets) ranges from 0.3 to 0.8 mm/yr. It is very likely that 20th-century warming has contributed significantly to the observed sea-level rise, through the thermal expansion of sea water and the widespread loss of land ice.
The Thomas Jefferson Memorial in Washington, D.C. is a presidential memorial dedicated to Thomas Jefferson
The Thomas Jefferson Memorial could be almost totally submerged if sea levels rise by 25 feet Certain positive consequences of rising temperatures, such as a longer growing season, were said to be offset by more disruptive impacts, including:
‘This draft report sends a warning to all of us: we must act in a comprehensive fashion to reduce carbon pollution or expose our people and communities to continuing devastation from extreme weather events and their aftermath,’ Senator Barbara Boxer, a California Democrat who heads the Senate environment committee, said in a statement. Some Democrats hope President Barack Obama will use his executive powers to clamp down further on some carbon-polluting industries. Obama has cited climate change as a priority since being re-elected in November, although many Republican lawmakers are wary of declaring a definitive link between human activity and evidence of a changing climate.
Some of the best-preserved examples of 19th-century urban design in the United States are found in the Back Bay neighborhood of Boston
How the rows of Victorian brownstone homes might look if water levels increase by 25 feet
A common perception is that the rate of sea-level rise should have accelerated during the latter half of the 20th century, but tide gauge data for the 20th century show no significant acceleration. Estimates obtained are based on atmosphere-ocean general circulation models (abbreviated AOGCMs) for the terms directly related to anthropogenic climate change in the 20th century, i.e., thermal expansion, ice sheets, glaciers and ice caps... The total computed rise indicates an acceleration of only 0.2 (mm/yr)/century, with a range from −1.1 to +0.7 (mm/yr)/century, consistent with observational finding of no acceleration in sea-level rise during the 20th century.[69] The sum of terms not related to recent climate change is −1.1 to +0.9 mm/yr (i.e., excluding thermal expansion, glaciers and ice caps, and changes in the ice sheets due to 20th century climate change). This range is less than the observational lower bound of sea-level rise. Hence it is very likely that these terms alone are an insufficient explanation, implying that 20th century climate change has made a contribution to 20th century sea-level rise.[25] Recent figures of human, terrestrial impoundment came too late for the 3rd Report, and would revise levels upward for much of the 20th century. Uncertainty in TAR sea-level projections [edit]The different SRES emissions scenarios used for the TAR sea-level projections were not assigned probabilities, and no scenario is assumed by the IPCC to be more probable than another.[70] For the first part of the 21st century, the variation between the different SRES scenarios is relatively small.[71] The range spanned by the SRES scenarios by 2040 is only 0.02 m or less. By 2100, this range increases to 0.18 m. Of the six illustrative SRES scenarios, A1FI gives the largest sea-level rise and B1 the smallest (see the SRES article for a description of the different scenarios). For the TAR sea-level projections, uncertainty in the climate sensitivity and heat uptake of the oceans, as represented by the spread of models (specifically, atmosphere–ocean general circulation models, or AOGCMs), is more important than the uncertainty from the choice of emissions scenario.[71] This differs from the TAR's projections of global warming (i.e., the future increase in global mean temperature), where the uncertainty in emissions scenario and climate sensitivity are comparable in size. Minority uncertainties and criticisms regarding IPCC results [edit]
Glacier contribution [edit]It is well known that glaciers are subject to surges in their rate of movement with consequent melting when they reach lower altitudes and/or the sea. The contributors to Annals of Glaciology [3], Volume 36 [72](2003) discussed this phenomenon extensively and it appears that slow advance and rapid retreat have persisted throughout the mid to late Holocene in nearly all of Alaska's glaciers. Historical reports of surge occurrences in Iceland's glaciers go back several centuries. Thus rapid retreat can have several other causes than CO2 increase in the atmosphere. The results from Dyurgerov show a sharp increase in the contribution of mountain and subpolar glaciers to sea-level rise since 1996 (0.5 mm/yr) to 1998 (2 mm/yr) with an average of about 0.35 mm/yr since 1960.[73] Of interest also is Arendt et al.,[74] who estimate the contribution of Alaskan glaciers of 0.14±0.04 mm/yr between the mid-1950s to the mid-1990s, increasing to 0.27 mm/yr in the middle and late 1990s. Greenland contribution [edit]Krabill et al.[75] estimate a net contribution from Greenland to be at least 0.13 mm/yr in the 1990s. Joughin et al.[76] have measured a doubling of the speed of Jakobshavn Isbræ between 1997 and 2003. This is Greenland's largest outlet glacier; it drains 6.5% of the ice sheet, and is thought to be responsible for increasing the rate of sea-level rise by about 0.06 millimetres per year, or roughly 4% of the 20th-century rate of sea-level increase.[77] In 2004, Rignot et al.[78] estimated a contribution of 0.04±0.01 mm/yr to sea-level rise from southeast Greenland. Rignot and Kanagaratnam[79] produced a comprehensive study and map of the outlet glaciers and basins of Greenland. They found widespread glacial acceleration below 66 N in 1996 which spread to 70 N by 2005; and that the ice sheet loss rate in that decade increased from 90 to 200 cubic km/yr; this corresponds to an extra 0.25–0.55 mm/yr of sea level rise. In July 2005 it was reported[80] that the Kangerdlugssuaq glacier, on Greenland's east coast, was moving towards the sea three times faster than a decade earlier. Kangerdlugssuaq is around 1,000 m thick, 7.2 km (4.5 miles) wide, and drains about 4% of the ice from the Greenland ice sheet. Measurements of Kangerdlugssuaq in 1988 and 1996 showed it moving at between 5 and 6 km/yr (3.1–3.7 miles/yr), while in 2005 that speed had increased to 14 km/yr (8.7 miles/yr). According to the 2004 Arctic Climate Impact Assessment, climate models project that local warming in Greenland will exceed 3 °C during this century. Also, ice-sheet models project that such a warming would initiate the long-term melting of the ice sheet, leading to a complete melting of the Greenland ice sheet over several millennia, resulting in a global sea level rise of about seven metres.[81] Antarctic contribution [edit]See also: Antarctica#Ice mass and global sea level On the Antarctic continent itself, the large volume of ice present stores around 70% of the world's fresh water.[82] This ice sheet is constantly gaining ice from snowfall and losing ice through outflow to the sea. West Antarctica is currently experiencing a net outflow of glacial ice, which will increase global sea level over time. A review of the scientific studies looking at data from 1992 to 2006 suggested a net loss of around 50 gigatons of ice per year was a reasonable estimate (around 0.14 mm of sea-level rise),[83] although significant acceleration of outflow glaciers in the Amundsen Sea Embayment could have more than doubled this figure for the year 2006.[84] East Antarctica is a cold region with a ground-base above sea level and occupies most of the continent. This area is dominated by small accumulations of snowfall which becomes ice and thus eventually seaward glacial flows. The mass balance of the East Antarctic Ice Sheet as a whole is thought to be slightly positive (lowering sea level) or near to balance.[83][84] However, increased ice outflow has been suggested in some regions.[84][85] In 2011 ice-penetrating radar led to the creation of the first high-resolution topographic map of one of the last uncharted regions of Earth: the Aurora Subglacial Basin, an immense ice-buried lowland in East Antarctica larger than Texas. The map reveals some of the largest fjords or ice cut channels on Earth. Because the basin lies kilometres below sea level, seawater could penetrate beneath the ice, causing portions of the ice sheet to collapse and float off to sea. The map is expected to improve models of ice sheet dynamics.[86] Sheperd et al. 2012, found that different satellite methods were in good agreement and combing methods leads to more certainty with East Antarctica, West Antarctica, and the Antarctic Peninsula changing in mass by +14 ± 43, –65 ± 26, and –20 ± 14 gigatonnes per year.[87] Effects of snowline and permafrost [edit]The snowline altitude is the altitude of the lowest elevation interval in which minimum annual snow cover exceeds 50%. This ranges from about 5,500 metres above sea-level at the equator down to sea level at about 65° N&S latitude, depending on regional temperature amelioration effects. Permafrost then appears at sea level and extends deeper below sea-level pole-wards. The depth of permafrost and the height of the ice-fields in both Greenland and Antarctica means that they are largely invulnerable to rapid melting. Greenland Summit is at 3,200 metres, where the average annual temperature is minus 32 °C. So even a projected 4 °C rise in temperature leaves it well below the melting point of ice. Frozen Ground 28, December 2004, has a very significant map of permafrost affected areas in the Arctic. The continuous permafrost zone includes all of Greenland, the North of Labrador, NW Territories, Alaska north of Fairbanks, and most of NE Siberia north of Mongolia and Kamchatka. Continental ice above permafrost is very unlikely to melt quickly. As most of the Greenland and Antarctic ice sheets lie above the snowline and/or base of the permafrost zone, they cannot melt in a timeframe much less than several millennia; therefore they are unlikely to contribute significantly to sea-level rise in the coming century. Polar ice [edit]The sea level will rise above its current level if more polar ice melts. However, compared to the heights of the ice ages, today there are very few continental ice sheets remaining to be melted. It is estimated that Antarctica, if fully melted, would contribute more than 60 metres of sea level rise, and Greenland would contribute more than 7 metres. Small glaciers and ice caps on the margins of Greenland and the Antarctic Peninsula might contribute about 0.5 metres. While the latter figure is much smaller than for Antarctica or Greenland it could occur relatively quickly (within the coming century) whereas melting of Greenland would be slow (perhaps 1,500 years to fully deglaciate at the fastest likely rate) and Antarctica even slower.[88] However, this calculation does not account for the possibility that as meltwater flows under and lubricates the larger ice sheets, they could begin to move much more rapidly towards the sea.[89][90] In 2002, Rignot and Thomas[91] found that the West Antarctic and Greenland ice sheets were losing mass, while the East Antarctic ice sheet was probably in balance (although they could not determine the sign of the mass balance for The East Antarctic ice sheet). Kwok and Comiso (J. Climate, v15, 487–501, 2002) also discovered that temperature and pressure anomalies around West Antarctica and on the other side of the Antarctic Peninsula correlate with recent Southern Oscillation events. In 2004 Rignot et al.[78] estimated a contribution of 0.04 ± 0.01 mm/yr to sea level rise from South East Greenland. In the same year, Thomas et al.[92] found evidence of an accelerated contribution to sea level rise from West Antarctica. The data showed that the Amundsen Sea sector of the West Antarctic Ice Sheet was discharging 250 cubic kilometres of ice every year, which was 60% more than precipitation accumulation in the catchment areas. This alone was sufficient to raise sea level at 0.24 mm/yr. Further, thinning rates for the glaciers studied in 2002–03 had increased over the values measured in the early 1990s. The bedrock underlying the glaciers was found to be hundreds of metres deeper than previously known, indicating exit routes for ice from further inland in the Byrd Subpolar Basin. Thus the West Antarctic ice sheet may not be as stable as has been supposed. In 2005 it was reported that during 1992–2003, East Antarctica thickened at an average rate of about 18 mm/yr while West Antarctica showed an overall thinning of 9 mm/yr. associated with increased precipitation. A gain of this magnitude is enough to slow sea-level rise by 0.12 ± 0.02 mm/yr.[93] Effects of sea-level rise [edit]Based on the projected increases stated above, the IPCC TAR WGII report (Impacts, Adaptation Vulnerability) notes that current and future climate change would be expected to have a number of impacts, particularly on coastal systems.[94] Such impacts may include increased coastal erosion, higher storm-surge flooding, inhibition of primary production processes, more extensive coastal inundation, changes in surface water quality and groundwater characteristics, increased loss of property and coastal habitats, increased flood risk and potential loss of life, loss of non-monetary cultural resources and values, impacts on agriculture and aquaculture through decline in soil and water quality, and loss of tourism, recreation, and transportation functions. There is an implication that many of these impacts will be detrimental—especially for the three-quarters of the world's poor who depend on agriculture systems.[95] The report does, however, note that owing to the great diversity of coastal environments; regional and local differences in projected relative sea level and climate changes; and differences in the resilience and adaptive capacity of ecosystems, sectors, and countries, the impacts will be highly variable in time and space. Statistical data on the human impact of sea-level rise is scarce. A study in the April, 2007 issue of Environment and Urbanization reports that 634 million people live in coastal areas within 30 feet (9.1 m) of sea level. The study also reported that about two thirds of the world's cities with over five million people are located in these low-lying coastal areas. The IPCC report of 2007 estimated that accelerated melting of the Himalayan ice caps and the resulting rise in sea levels would likely increase the severity of flooding in the short term during the rainy season and greatly magnify the impact of tidal storm surges during the cyclone season. A sea-level rise of just 400 mm in the Bay of Bengal would put 11 percent of the Bangladesh's coastal land underwater, creating 7–10 million climate refugees.
Submerged city: In centuries to come Ocean Drive could be submerged in 25 feet of water according to global warming projections
Boston is another area which could be significantly impacted by rising sea levels, these images show the harbor today, left, and then under 25ft of water, right According to the U.S. National Climate Assessment, a congressionally mandated study released earlier this year, the consequences of climate change are now hitting the United States on several fronts, including health, infrastructure, water supply, agriculture and especially more frequent severe weather. The report claims observable change to the climate in the past half-century ‘is due primarily to human activities, predominantly the burning of fossil fuel,’ and that no areas of the United States are immune to change. ‘Corn producers in Iowa, oyster growers in Washington State, and maple syrup producers in Vermont have observed changes in their local climate that are outside of their experience,’ the report said. Months after Superstorm Sandy hurtled into the U.S. East Coast, causing billions of dollars in damage, the report concluded that severe weather was now the new normal. ‘Certain types of weather events have become more frequent and/or intense, including heat waves, heavy downpours, and, in some regions, floods and droughts,’ the report said.
This series of images show how the Statue of Liberty might be impacted by rising sea levels, left, as it is today and then right, after an increase in sea level of five feet
Left, how the Statue of Liberty could look in 2300 when sea levels may have risen to 12 feet, then after levels have increased 25 feet in several centuries
Holiday hotspot: South Beach in Florida as it looks today
South Beach in Florida could be totally submerged in the future if the sea levels rise 25 feet. Last year was the hottest year ever in the United States. According to the Intergovernmental Panel of Climate Change, the seas will rise by an average of 6.6 feet by 2100. Then over the coming centuries, as temperatures rise and ice sheets melt, the oceans could rise as much as 20 or 30 feet. Lamm has created images which show how famous landmarks could look like under 5 feet (projected increase over the next 100 to 300 years), 12 feet (potential level in 2300), and 25 feet (the potential level in coming centuries) of water. The U.S. National Climate Assessment report notes that of an increase in average U.S. temperatures of about 1.5 degrees F since 1895, when reliable national record-keeping began, more than 80 percent had occurred in the past three decades. With heat-trapping gases already in the atmosphere, temperatures could rise by a further 2 to 4 degrees F in most parts of the country over the next few decades, the report said. For nearly 80 US cities, the watery future would come much sooner, within the next decade. Photograph: Joe Raedle/Getty Images More than 1,700 American cities and towns – including Boston, New York, and Miami – are at greater risk from rising sea levels than previously feared, a new study has found. By 2100, the future of these 1,700 locations will be "locked in" by greenhouse gas emissions built up in the atmosphere, the analysis published in the Proceedings of the National Academy of Sciences on Monday found. The survey does not specify a date by which these cities would actually fall under water. Instead, it specifies a "locked-in" date, by which time a future under water would be certain – a point of no return. Because of the inertia built into the climate system, even if all carbon emissions stopped immediately, it would take some time for the related global temperature rises to ease off. That means the fate of some cities is already sealed, the study says. "Even if we could just stop global emissions tomorrow on a dime, Fort Lauderdale, Miami Gardens, Hoboken, New Jersey will be under sea level," said Benjamin Strauss, a researcher at Climate Central, and author of the paper. Dramatic cuts in emissions – much greater than Barack Obama and other world leaders have so far agreed – could save nearly 1,000 of those towns, by averting the sea-level rise, the study found. "Hundreds of American cities are already locked into watery futures and we are growing that group very rapidly," Strauss said. "We are locking in hundreds more as we continue to emit carbon into the atmosphere." A recent study, also published in PNAS by the climate scientist Anders Levermann found each 1C rise in atmospheric warming would lead eventually to 2.3m of sea-level rise. The latest study takes those figures, and factors in the current rate of carbon emissions, as well as the best estimate of global temperature sensitivity to pollution. This shows that the list of cities at risk of being "locked in" by 2100 spans Sacramento, California – which lies far from the sea but would be vulnerable to flooding in the San Joaquin delta – and Norfolk, Virginia. The latter town is home of America's largest navy base, whose miles of waterfront installations would be at risk of being locked in to future sea level rises by the 2040s. The Pentagon has already begun actively planning for a future under climate change, including relocating bases. About half the population of Cambridge, Massachusetts, across the Charles River from Boston and home to Harvard and MIT, could be locked in to a future below sea level by the early 2060s, the study found. Several coastal cities in Texas were also vulnerable. But the region at highest risk was Florida, which has dozens of towns which will be locked by century's end. The date of no-return for much of Miami would be 2041, the study found. Half of Palm Beach with its millionaires' estates along the sea front would be beyond saving by the 2060s. The point of no return for other cities such as Fort Lauderdale would come before that. "Pretty much everywhere it seems you are going to be under water unless you build a massive system of dykes and levees," Strauss said. The study drew on current research on sea-level rise, now growing at 1ft per decade.
|
|


.png)


.png)
No comments:
Post a Comment